Sysprof
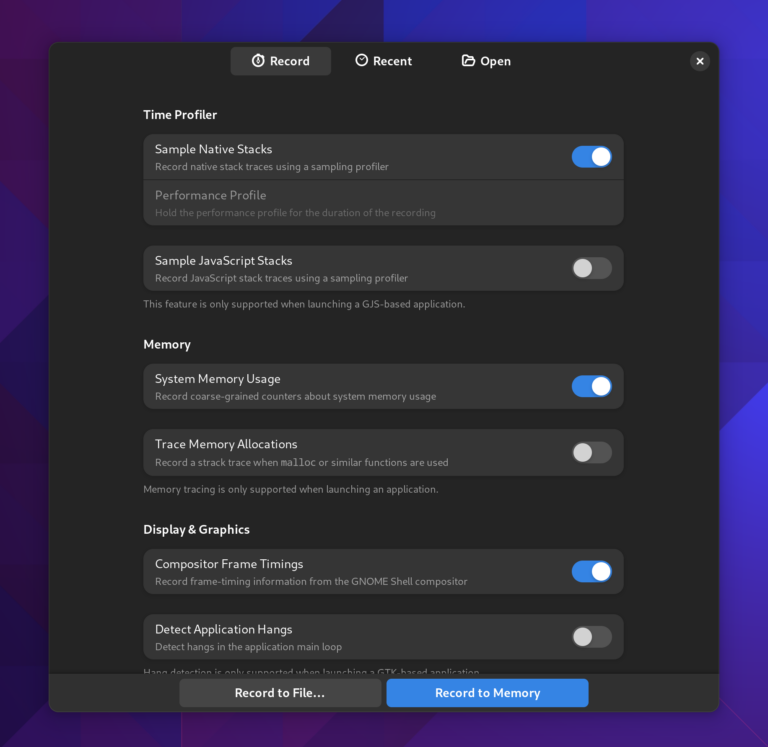
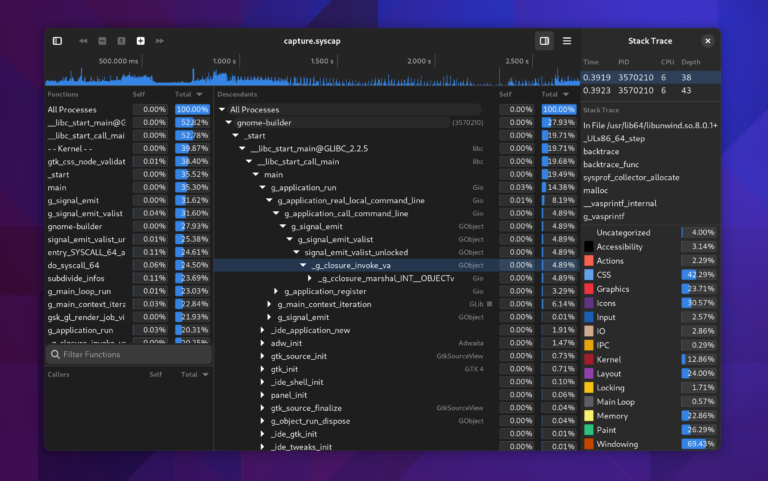
Sysprof is a modern system-wide profiling tool that helps in finding the functions in which a program uses most of its time and resources. It provides detailed, accurate, and fast profiling of the entire Linux system, including the kernel and all userspace applications (and their interactions) at the same time.
Among its key features are:
- Fast, no-nonsense graphical user interface that is easy to use, for any tester or developer;
- No patching/recompiling necessary;
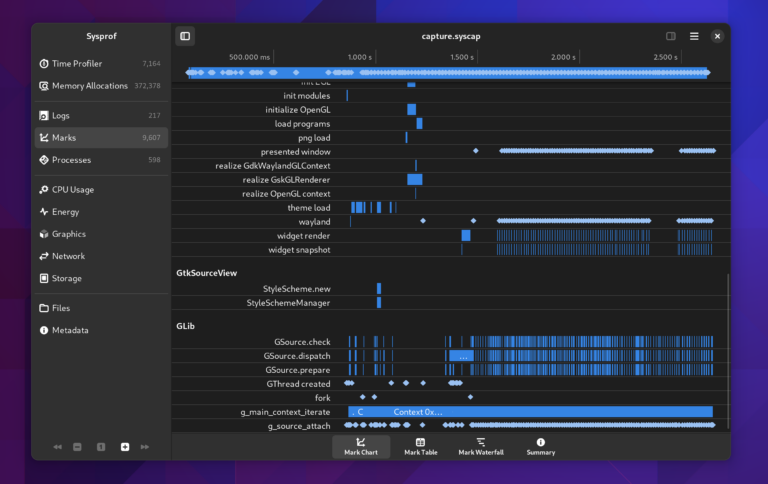
- Accurate measurements, paired with clear and beautiful graphical data visualization for various resource counters (cpu, net, mem, cpufreq, energy consumption, battery charge, etc), logs, files, and marks with visualizers for them.
- Ability to save captured profiles, or open someone else's "syscap" file that they have shared with you in a bug report.
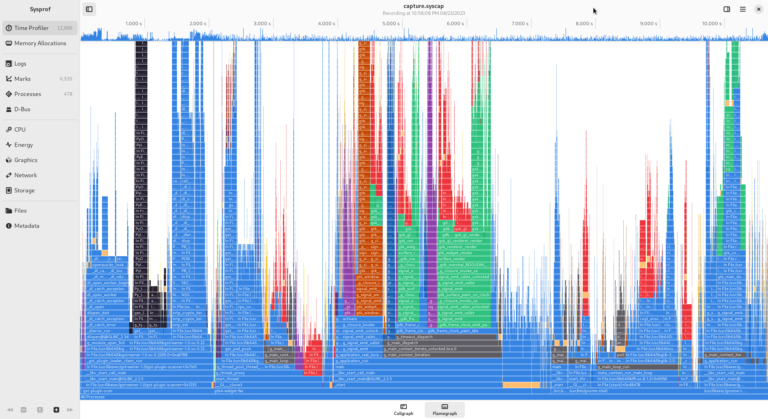
- Various nice data visualizations for your selected portion of the timeline!
For the more technically-inclined among you, sysprof provides:
- Callgraphs (based on stacktraces obtained via perf);
- A binary capture format (which makes it very convenient to work with capture files to write custom tooling, unlike perf.dat or pprof);
- A “control fd” that can be sendmsg()d to peers or inherited by subprocesses w/ SYSPROF_CONTROL_FD=n set allowing them to request a ring buffer (typically per-thread) to send accessory information which is muxed into the capture file;
- Memory profilers (via LD_PRELOAD) which use the above to collect allocation records and callgraphs to visualize temporaries, leaks, etc.;
- Integration with language runtimes like GJS (GNOME’s "Spider Monkey" engine used by GNOME shell and various applications) to use timers and SIGPROF to unwind/collect samples and mux into captures;
Integration with platform libraries like GLib, GTK, Mutter, and Pango which annotate the recordings with information about the GPU, input events, background operations, etc.;
- The ability to decode symbols at the tail of a recording and insert those mappings (including kallsyms) into the snapshot. This allows testers to provide a compressed recording that developers can open locally without the same binary versions or Linux distribution.
Installation
Sysprof can be found as a native package in many recent Linux distibutions, or obtained from GNOME Git, inside the sysprof module:
git clone https://gitlab.gnome.org/GNOME/sysprof
If building it yourself, you need to compile it using the kernel headers package provided by your distribution. Read then the Sysprof quickstart to set it up.
Documentation
Useful resources
Christian Hergert's blog posts about sysprof, including (among many others):
A blog post on why your distro needs to enable frame pointers for Sysprof to provide optimal data
Presenting the new sysprof GUI in GNOME 45
- Old sysprof resources:
sysprof.com: Sysprof's old and very obsolete homepage. Someone should fix this...
/ideas - Ideas for future improvements to sysprof.
Examples of use
How to use sysprof 3, by Christian Hergert (2020)
Profiling & optimizing GNOME Software, by Georges Stavracas (2023)
- Sysprof 45 being used to troubleshoot performance issues across GNOME 45, an example in three parts:
How to use Sysprof (again), by Christian Hergert (2023)
More Sysprof’ing, by Christian Hergert (2023)
Profiling with medium-aged hardware, by Christian Hergert (2023)
- Old examples of use:
Profiling Gedit, by Federico (2005)
Profiling the file chooser, by Federico (2005)


